
I always wanted to track my house's power consumption and usage. I have an Efergy monitor but it doesn't have PC (USB|Serial) connection so I decided to try to get some information.
Hardware
Transmitter
The transmitter has three 3.5'' jacks for connecting one or three current clamps (monophase vs triphase).
It transmits current information every 6, 12 or 18seconds (configurable with push button)
I configured mine every 6 seconds to help with sniffing information
Receiver
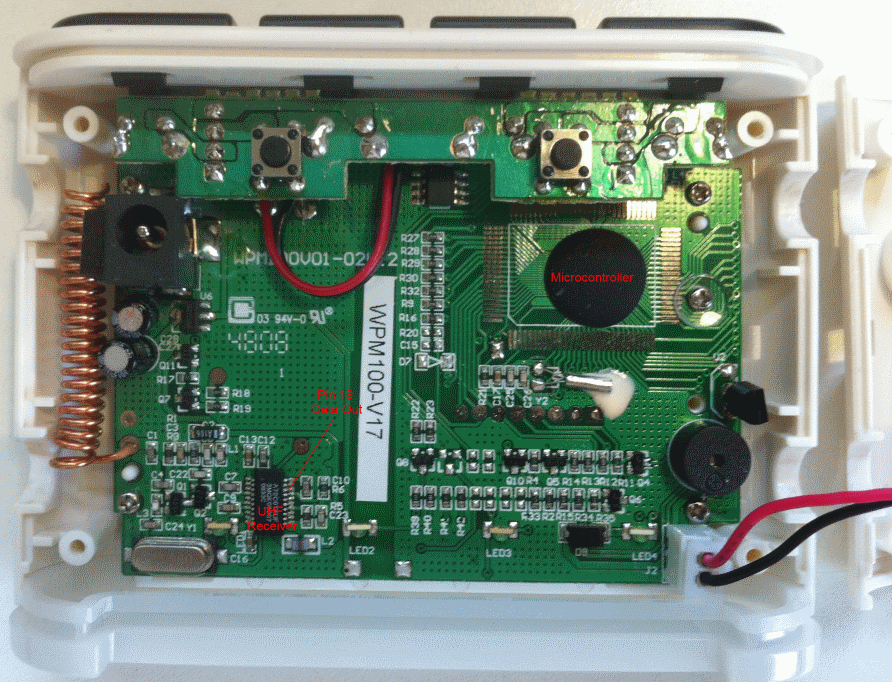
RF Side
The wireless monitor uses an AMICCOM A7201A UHF receiver (SSOP20 package) working in hardware pin mode (SPI disabled)
It's configured as:
| Pin |
Name |
Value |
Comment |
| 13 |
SPIS |
Low |
Disable SPI -> Hardware Pin mode |
| 14 |
BAND |
High |
434 Mhz |
| 15 |
SPI_CLK |
Low |
Not used |
| 16 |
AFSK |
Low |
FSK |
Pin 18 is data out.
I hooked a scope on this pin, and I can see a pulse train every 6 seconds. See a data sample: Efergy.xlsx
Communication

The first pulses (~2.6 to ~3.8 msec) are variable and I assume is some sort of pseudo-random information to match transmitter with receiver. This pulse is variable and I've seen if ranging from ~1 to ~4 mseconds.
Then, at ~7,6 msec there's a long high pulse that leads the data start. At ~8.6 msec the actual data starts.
In the following graph, you can see the overlapped data start of 6 transmissions:

Each bit starts at each high to low transition.
The encoding for 1s is to have a >50% duty cycle for the bit.
The encoding for 0s is to have a <50% duty cycle for the bit.
In the next graph, you can see the whole data transfer. Red line shows bit times (316 usec bit time -> 3200 baud?) . Green line shows bits: 1 (pulse present) or 0 (no pulse)

The data from the previous graph can be read as:
00000000 01001011 10101001 00000000 00000....
There are some missing bits in the graph. The complete sequence is:
00000000 01001011 10101001 00000000 00000001 00000000 00000010 00000000 11110111
Transformed to decimal:
0 75 169 0 1 0 2 0 247
Then I started measuring the same data with different loads in the current clamp:
| Byte |
Data |
0 watt (no current) |
0 watt (No clamp conn.) |
2 watt (Led lamp) |
40 watt (Bulb) |
60 watt (Bulb) |
100 watt (Bulb) |
600 watt (Some appliances) |
800 watt |
1860 watt |
2180 watt (+microwave) |
2960 watt |
3060 watt (+electric oven) |
4230 watt (+air condition) |
| 1 |
|
0
|
0
|
0
|
0
|
0
|
0
|
0
|
0
|
0
|
0
|
0
|
0
|
0
|
| 2 |
|
75
|
75
|
75
|
75
|
75
|
75
|
75
|
75
|
75
|
75
|
75
|
75
|
75
|
| 3 |
|
169
|
169
|
169
|
169
|
169
|
169
|
169
|
169
|
169
|
169
|
169
|
169
|
169
|
| 4 |
|
0
|
128
|
0
|
0
|
0
|
128
|
0
|
0
|
0
|
0
|
0
|
0
|
0
|
| 5 |
|
1
|
1
|
1
|
1
|
1
|
1
|
0
|
0
|
0
|
0
|
0
|
0
|
0
|
| 6 |
|
0
|
0
|
0
|
0
|
0
|
0
|
0
|
16
|
16
|
16
|
16
|
32
|
32
|
| 7 |
|
2
|
2
|
2
|
2
|
2
|
2
|
1
|
1
|
1
|
1
|
1
|
1
|
1
|
| 8 |
Current? |
0
|
0
|
2
|
16
|
24
|
39
|
243
|
38
|
172
|
201
|
253
|
11
|
75
|
| 9 |
Checksum |
247
|
119
|
247
|
7
|
15
|
158
|
232
|
43
|
177
|
206
|
2
|
32
|
96
|
In the Efergy receiver, you have to manually set the voltage (230 v in my case) so I assume what's transmitted is the 6 seconds current average.
Doing some analysis:
| Byte |
Data |
0 watt |
2 watt |
40 watt |
60 watt |
100 watt |
600 watt |
800 watt |
1860 watt |
2180 watt |
2960 watt |
3060 watt |
4230 watt |
| 6 |
|
0
|
0
|
0
|
0
|
0
|
0
|
16
|
16
|
16
|
16
|
32
|
32
|
| 8 |
|
0
|
2
|
16
|
24
|
39
|
243
|
38
|
172
|
201
|
253
|
11
|
75
|
| |
|
|
|
|
|
|
|
|
|
|
|
|
|
| |
LCD reading |
0
|
|
40
|
60
|
90
|
0.60k
|
0.80k
|
1.86k
|
2.18k
|
2.96k
|
3.06k
|
4.23k
|
| |
Calculated
Current
|
|
|
40/230 =
0.17 A
|
60/230 =
0.26 A
|
90/230 =
0.39 A
|
600/230 =
2.61 A
|
800/230 =
3.47 A
|
1860/230 =
8.09 A
|
2180/230 =
9.47 A
|
2960/230 =
12.87 A
|
3060/230 =
13.3 A
|
4230/230 =
18.39 A
|
| 8 |
Byte 8 * 0.01A |
|
|
0.16 A
|
0.24 A
|
0.39 A
|
2.43 A
|
|
|
|
|
|
|
It seems that the current is shown in Byte 8 in 0.01 A increments (Maximum 2.55 A). When the counter overflows, I see byte 6 moving. I guess each bit it's some kind of multiplier of the Maximum.... I need more data to be sure....
CPU Side
There's a microcontroller glued to the PCB but no information about brand/model. There are some hints about the Xtal location but nothing more....
Next Steps
Links
Comments (Show all 68)
Jean Collin said
at 9:24 pm on Jun 1, 2011
OK I thought I could see the screw holes in the front behind the border so I guess its time to hack it open !!!
Can I just expose data line and GND since the digital input to arduino will measure voltage I assume HIGH 3.3V low 0V ?
Also what simple algorithm worked best for U ?I guess something like wait for long high pulse (500ms you mentioned (E2) graph shows 1000ms (ELITE)) then grab 8 bytes or 72 bits (including checksum) at known intervals or until some condition ?
do I need to set a Baud Rate up from the digital in Side that matches E2 or should I just read bytes ? ( I have never done this before and have no experience of reading digital data but it cant be too dificult !) if you have a script in PIC or another language I can try and make sense of it to get an idea of what you did.
In the end an Arduino version would be cool for the community so im prepared to help out but probably need to ask Arduino Forum how I should go about it. you could provide me with the simple steps required and I can work out how to do it.
So how do you syncronise and repeat the above steps you have given me to achieve data changes at 6sec intervals ?
Ill open the case tomorrow !!!
Jean
alex said
at 9:42 pm on Jun 1, 2011
steps I've used:
Loop
Is it high/low pulse?
Is it high?
Duration >500us?
Flag as incoming data & start the interpretation timer.
Is it LOW?
Duration > 500ms?
Potential incoming data... set flag (this is the low pause before the high burst potentially)
Should we send data?
Send (if the SEND DATA flag is set , after the interpretation of the results - see below), then send data.
The timer is begins to run after the 500us high pause and decodes each data at the middle of each 200us interval.
More precisely: if you start the timer at the right point (at the exact end of the long HIGH pulse) & read the data line at precisely 100us = half of the period, you can distinguish between a 1 (high) and a 0 (low).
After we've read the 8th byte, flag data as "to be sent" and the normal loop will send it when it gets there. Stop the 100us timer also.
After sending the data, clear everything up.
Good luck
Jean Collin said
at 10:45 pm on Jun 1, 2011
wow look forward to giving that a go Ill keep you posted !! I think its a fantastic solution although may not be altogether accurate given that we are guessing the voltage (in my case 110V in Costa Rica) but at least I have a reference display to calibrate and also its cool that no wire is needed between fusebox and display since data is collected at the display which means you can have it all in a dryer place. for my purpouse just to have the data online is fine it doesnt have to be super accurate as long as I can see activity like when a pool pump is running or AC units or if the dryer is on when I´m back in UK.
Jean Collin said
at 2:35 am on Jun 2, 2011
int E2Pin = A5; // Digital Input Pin allocated to E2 output
int E2Bytes = 8; // bytes of data required
int pulseDUR = 200; // pulse duration of data in usecs
int leadHIGH = 500; // lead HIGH duration in usecs
long longLOW = 500000;// long LOW duration in usecs before leadHIGH
boolean DataIN = LOW;// flag to determine when to collect dataIN
boolean pauseLOW = LOW;// flag to determine of pauseLOW period has occured
boolean E2pulse; // pulse of data reived from E2
//pulseIn() used here to our benefit
//Reads a pulse (either HIGH or LOW) on a pin. For example, if value is HIGH, pulseIn() waits for the pin to go HIGH,
//starts timing, then waits for the pin to go LOW and stops timing. Returns the length of the pulse in microseconds.
//Gives up and returns 0 if no pulse starts within a specified time out.
//The timing of this function has been determined empirically and will probably show errors in longer pulses.
//Works on pulses from 10 microseconds to 3 minutes in length.
//Syntax
//pulseIn(pin, value)
//pulseIn(pin, value, timeout)
// main loop starts here
void setup()
{
pinMode(E2Pin,INPUT);
DataIN = LOW;
pauseLOW = LOW;
}
void loop()
{
E2pulse = digitalRead(E2Pin); // get à value of E2 Digital Pin
if (E2pulse == HIGH) {
if ( pulseIn(E2Pin, HIGH) >= leadHIGH) { // see if we have reached start of data
if (pauseLOW == HIGH) { // only set ready to accept reading data if pauseLOW has passed
DataIN = HIGH;
}
} // else ignore and go round again
}
else { // pulse is LOW check if short or long
if ( pulseIn(E2Pin, LOW) >= longLOW) { // skip the long low period
pauseLOW = HIGH;
}
}
if ( DataIN == HIGH ) { // time to collect the get the data we want
get_next_nbytes ( E2Bytes+1, pulseDUR);
// send data here if we want
DataIN = LOW; // reset vars
pauseLOW = LOW;
}
}
Jean Collin said
at 2:36 am on Jun 2, 2011
// function to read next nbytes at Cycle microsecond intervals
void get_next_nbytes(int Nbytes,int Cycle);
{
delayMicroseconds(Cycle/2) // delay a 1/2 cycle to be bang in middle of pulse
for (Byte = 1 , Byte <= Nbytes , Byte++) {
for (Bit = 1 , Bit <= 8 , Bit++) {
data_array[Byte][Bit] = digitalRead(E2Pin); // store value in array
delayMicroseconds(Cycle) ; // delay to land in the middle of each bit
}
}
}
Jean Collin said
at 2:39 am on Jun 2, 2011
sorry the above was not formatted with indents its just a skeleton for you to look at
Jean
alex said
at 3:19 am on Jun 2, 2011
Sorry Jean, but my Arduino skills are not up to this level... In terms of how it's done it looks ok as a pseudo-code. Try presenting the code to the Arduino community, I'm sure they would do better than me.
My suggestion would be to use a logic analyzer for debugging purposes (toggle some pins to check where the actual reading takes place). You can do without, but it would save you a lot of time.
The Windows Forms application (found in Files) allows you to set the voltage, so yes, you could use it even in Costa Rica.
Jean Collin said
at 12:08 pm on Jun 3, 2011
There is no need to test your soldering skills that much I put a meter on continuity and there is actually a test point to pin 18 (see diagram above) 3mm above pin 20 that silver round disc is connected to pin 18 ;-). ok time to make the socket !!!
alex said
at 9:12 pm on Jun 4, 2011
Just a sidenote:
I finished the website for the efergy.
It stores all of the incoming measurements into a database. The meter samples every 6s. I expect the database to be rather large after two years, but for the time beeing, my small 500mhz pico-itx computer handles it very well.
The shock (and the reason for this post) is that the total for a day (and I suspect for a month, will confirm that after a month period) shown by the meter, by pressing the history button, is miscalculated. Not by 1-3watts/h, but by a rather astonishing figure: 1KWh.
I saw a difference today (the first day with a day long logging session in place).
First thing I did, I rechecked my calculation. No complex math involved, so should be pretty obvious. Then I noticed that some samples were missing (1168 out of 14.400 for 24h if the interval is 6s). So I've replaced the missing samples with the reading just before the missing package. Still, the difference is quite large
- calculated data based on the incoming readings : 5.96KWh for today,
- meter shows total for today 6.99KWh.
I triple checked (by adding the values in the database, by adding them in C# code, etc), no rounding, no nothing.
I pretty much suspect they're wrong with the meter, because in the database I pretty much have the same thing that was shown on the screen of the meter...
As soon as more data will be logged, I hope to get a better picture of the problem. But I suspect it's not in my code.
Good night
alex
Jean Collin said
at 10:02 am on Jun 6, 2011
intresting observation good work !! I have wired up as per the diagram but dont get to see much data until i disconnect and reconnect the dataout line , Im not able to make much sense of what is incoming at this time and the databusrts seem to be sporadic , Im sure the arduino can handle down to 5us cycles so seeing data even polling at 200us intervals you would think you see something but no luck, could it be the earth connection ? I have writen a simple logic analizer that looks for change of state and logs in microseconds how long they lasted but it wont trigger unless I disconnect and reconnect the pin18 link and then doesnt continue to flow. I was hoping to see the long low of 500ms and the short high of 500us but nothing like that. shame to have got this far and give up so any ideas ?
alex said
at 11:41 am on Jun 6, 2011
I would suspect you're driving high the pin output, instead of having it as an input.
If you leav the arduino connected for a long(er) time, does the efergy meter still receives valid data or does the screen go "- - -"?
Like I told you, for debugging purposes a Logic Analyzer (like the Saleae for ex) would be a very good choice. I really can't help without having an idea of what's going on.
You could test your "logic analyzer" software by plugging it on a function generator (a soundcard maybe?).
Jean Collin said
at 9:45 am on Jun 8, 2011
I had no luck extracting digital data from pin18 dont know what the reason is but kinda giving up for now... would it however be possible to find a point on the Tx that Yelds a voltage proportional to the current consumption without affecting the existing data it send the the Rx ? Reason for asking is I still want to use the existing CT clips to measure my house consumption but just want to "tap in" to the Tx. Once I have this proportional voltage I can scale it up and calibrate it to the match the readout on the display. Any help welcome.
ottyphc said
at 7:13 pm on Jul 8, 2011
Has anyone looked at the Efergy Elite or E2 sold in North America. I have one of each and want to see if I can obtain data from them for energy logging and analysis. I think the only difference is that the N.A. version requires two (2) sensors connected to the transmitter instead of one (1). I would assume the data stream will carry twice the data.
Once I get access inside the Elite I will connect pin 18 to a logic analyzer to see what the data steam looks like, and if I can decipher it. If so, I will employ a PIC to decode it and transmit it via serial port to a TS7800 embedded computer that provides a number of related functions including controlling my wood boiler and heating system.
Any advise would be helpful. Thks!
alex said
at 7:21 pm on Jul 8, 2011
I think the data output will still be the same. My guess is that the summed up value will be transmitted, even if you use 1,2 or 3 current sensors connected to one transmitter.
Nothing sure, but decoding things will not be that hard because:
- the PIC software outputs all of the 8 bytes that are transmitted
- you can swap the current sensor position in the transmitter jacks => see what changes
my 2c.
ottyphc said
at 8:02 pm on Jul 8, 2011
thanks alex
Scott Yanke said
at 5:27 pm on Mar 17, 2012
Having recently purchased an Efergy E2 in the U.S., I thought I'd take a crack at recording the detail of what the transmitter was sending using the information others have already provided. Since the Elink software doesn't go into the detail I need, I'm using the same tap into the receiver as described, and recording the information to an SDHD card using an Atmel ATMEGA328 MCU.
I ran into some difficulty in that Efergy apparently changed the protocol since the postings in 2011. What I'm seeing now is the same 500 microsend high level as the start of the data, but only 64 bits are now transmitted instead of 72 (or more). The transmission is sent high bit first. The first 3 bytes worth are the transmitter id. The fourth byte holds the interval, reading 0x40 for 10 seconds, 0x50 for 15 seconds, and 0x60 for 20 seconds. I'm guessing there's still a bit for the battery level in that byte. The last byte, number 8, holds the checksum in mod 256 format. Add bytes 1 through 7, do the mod 256, and you get byte 8.
Bytes 5 and 6 hold the primary amp level, with byte 5 as the high byte. Byte 7 is the factor for the calculation. To obtain the amperage, take the number from bytes 5 & 6 and divide it by 32768. Then multiply that by 2 raised to the number in byte 7. For example, if bytes 5 and 6 are 0x6a52 (27218 decimal), and byte 7 is 0x03, the calculation to get the amperage is (27218/32768)*2^3. The calculation hasn't changed from previous posts. To get your wattage, just multiply that result by the voltage. If byte 7 is 0xff, then the formula is (value/32768)*2^-1, aka (value/32768)/2.
The major change from the earlier comments is that the transmitter is sending 64 bits worth, or 8 bytes, versus the 9 that other people were seeing. The fourth byte, which has the interval, is also different. The math is still the same for recovering the amperage.
My late 2 cents worth.
lond said
at 6:45 pm on May 18, 2012
Hi!
I'm using 3 sensors because in Sweden we have 3-fase system. What I found is that the 3 inputs is 12bits resolution. So Input 1 uses byte 8 and the high 4bits of byte 6, Input 2 uses byte 7 and the low 4bits of byte 6 and input 3 uses byte 5 and the low 4bits of byte 4. So my code looks like this:
CH1 = Out[5] ( 0 to 8 instead of 1 to 9)
CH1 = CH1 >> 4
CH1 = CH1 << 8
CH1 = CH1 + Out[7]
CH2 = Out[5]
CH2 = CH2 << 12
CH2 = CH2 >> 4
CH2 = CH2 + Out[6]
CH3 = Out[3]
CH3 = CH3 << 12
CH3 = CH3 >> 4
CH3 = CH3 + Out[4]
Tot = CH1 + CH2 + CH3
Then I get a sum of CH1, CH2 & CH3 to use for calculate the Watts.
/// Marcus
IAN KNOWLES said
at 10:45 am on Jul 8, 2012
PART1of2: Efergy Decoder using PIC
Many thanks to all the contributors to this page. I just wanted to offer some notes to anyone who is considering trying this addition to their Efergy E2 Monitor using a PIC MCU.
I managed successfully to decode the incoming data correctly using a PIC MCU (in my case a 16F648A which I had knocking around). I used slightly different methods than others on the site, as I found the mark:space ratio triggers for determining a logic 1 to logic 0 wasn't always at the 200uS boundaries (AKA a Symbol). Instead, I used a timer to measure the size of each part of the waveform and then compare the High part to Low Part to determine the symbol being a logic 1 or 0 data.
Warning - Making the h/w mod for tapping onto the internals of the Efergy E2 (Pin 18 of the decoder chip) is a tricky task. You need some thin wire (in my case thin enamel copper wire) which I tacked onto the pin and then super glues down. At this point and I then took a larger (normal) multistranded cable out to the PIC development board. The ground wire went directly to the battery wire terminal
I also needed to drive the PIC I/O with a hugher voltage (5V) pulse. I achieved this by using a simple N-Channel Mosfet to create an Inverter, with Drain connected via a Pull-up (10K) to 5V and then gate connected to the Efergy Decoder at pin 18. A 1MOhm resistor between Gate and source ensured the VGS voltage was pulled below the threshold in the low state. The Efergy drives at about 2.5V, which is ample for a BS170 N-Channel Mosfet (VGS-On) state NB Pulses are inverted to that described on the site.
IAN KNOWLES said
at 10:45 am on Jul 8, 2012
PART1of1: Efergy Decoder using PIC
I Setup the PIC to have IRQ Enabled on RB0. This then triggered the measurements as such when the sync detect pulse was detected (500uS) which then set the IRQ edge to detect the opposite edge trigger. The code then toggled the Edge detection as we progressed along the waveform. I used TMR0 to measure the HIGH and LOW pulses with a prescaler setup on TMR0 to ensure that we had enough resolution on TMR0 before a wrap around. I also used TMR0 to detect the 500uS Sync symbol but used a trick of changing the Pre-Scaler value of TMR0 such that we had good resolution for detection.
Following on from this mechansim, I used a 16bit Timer (TMR1) to then reduce the overhead of detecting the pre-amble of the efergy protocol by holding off any decoding for about 10ms on the detection of the first IRQ edge. TMR1 was also set at the start of decoding (i.e just after the Sync Symbol) to then clear the synchronistion state down and flag to the main loop that we had Bytes (stored in simple arrays) to send via RS232. I found that sending the bytes during actual decoding could affect the timing of the PIC MCU. So sending the bytes at the end of the valid data was a good move.
Overall, this method seems stable and hopefully will be robust against any symbol duration. The PIC was using a 20MHZ Crystal as the clock, but I also now intend to set the internal 4MHZ clock using the prescaler trick to ensure the resolutions are correct.
I can also advise that the 8 Byte data train is correct as advised in previous postings.
Once again, thanks to all for the intial R&D and Waveform information.
Ian
Peter said
at 4:44 pm on Jun 18, 2013
I'm trying to do similar e2 decoding, but using a separate cheap software defined radio receiver dongle to capture the efergy data burst.
As a first step I've managed to get the dongle to dump out data transmitted at 433.52Mhz and have decoded the waveform manually. Its using pulse width modulation as found above, with two long highs prefixing the data burst.
Its similar to what's described above but not exactly the same, here's the bytes received when the monitor indicated 611W
bytes1-9:
0 = 00000000
129 =10000001
147 =10010011
64 =01000000
252 =11111100
0 =00000000
2 =00000010
0 =00000000
82 =01010010 ([SUM] 594 MOD 256 = 82 CHECKSUM OK)
I've tried putting this through Alex/jdesbonnet's algorithm but it doesn't tally up :( Anyone have any ideas?
Peter said
at 5:33 pm on Jun 18, 2013
thats 230V
Joe Desbonnet said
at 11:15 pm on Aug 13, 2013
I've been looking at both the Efergy Elite and Efergy E2 with a RTL2832U and RTL-SDR software. So far I've made good head way on the Elite ... decoding a days worth of data now with at least 95% frames successfully decoded. See
https://github.com/jdesbonnet/rtl-sdr-efergy . I'm starting to look at the E2 radio frames (which seem far more compact and a little more challenging). Peter : how far did you get with the SDR approach?
Peter said
at 6:58 am on Aug 14, 2013
Didn't make much progress unfortunately. Had recorded the transmissions and managed to decode manually by hand. So with my e2 transmitter there is a low frequency carrier with high frequency bursts representing the 0s (short high freq burst) or 1s (longer high freq burst). The checksum tallied as above using this method.
I'd then tried to get a high pass filter to remove the carrier and time the high freq bursts, but hadn't managed to get anywhere either adapting rtl_433 or using gnu radio :(
Your use of rtl_fm has peaked my interest again though, might have another look at it.
Joe Desbonnet said
at 8:47 am on Aug 14, 2013
Here is a chart of a frame using rtl_fm
https://wombat-blog.googlecode.com/files/e2_frame_rtl_fm.png
and if I remember correctly this is the command line used to capture it:
rtl_fm -f 433.55M -W -s 200000 -r 200000
Joe Desbonnet said
at 9:01 am on Aug 14, 2013
And here is the raw data directly from the rtl_fm command:
https://wombat-blog.googlecode.com/files/efergy-e2-frame-200ksps-1.6amps.raw
Peter said
at 8:48 am on Aug 15, 2013
I'm getting better raw dumps looking at audacity with these parameters. Cleaner signal and doesn't look much different to the pics above.
rtl_fm -f 433460000 -s 200000 -r 96000 -g 28
A dump:
https://mega.co.nz/#!joBimJqZ!ZbT84H5uu2h0kLKAV1ycbzrml2w-DmUXcMBNOkRXm5M
piping to elite-decode I get
Found 1 device(s):
0: Realtek, RTL2838UHIDIR, SN: 00000001
Using device 0: ezcap USB 2.0 DVB-T/DAB/FM dongle
Found Rafael Micro R820T tuner
Oversampling input by: 6x.
Oversampling output by: 1x.
Buffer size: 6.83ms
Tuned to 433760000 Hz.
Sampling at 1200000 Hz.
Output at 96000 Hz.
Tuner gain set to 28.00 dB.
******
START OF FRAME: lc=11589 ts=69510
Then it sticks there. When I get more time I'll try to investigate
Joe Desbonnet said
at 11:36 am on Aug 15, 2013
Peter: that decoder won't work with the E2 (just the 'Elite' model) i'm looking at the E2 separately. It's interesting: your waveform looks different to my E2.
Peter said
at 12:05 pm on Aug 15, 2013
Yea guessed that gave it a bash in case it was the same. My transmitter looks like this, and receiver is def a e2.
https://mega.co.nz/#!awQUmKxa!SapoP0MjuiQXe8KLXTiRfCeBW4B4968yOJO1En7b6cU
Peter said
at 12:19 pm on Aug 15, 2013
Might either be the slightly off tuned frequency I'm using or the gain parameter which is causing your skewed waveform? Tweaking should make it look like mine I think, I'd seen waveforms like yours in the past when tweaking the parameters.
Peter said
at 2:53 pm on Aug 15, 2013
Inspired by your code I tried a few things.
See linked file. Really rough code, but initial step for decoding my e2 transmitter anyways - it decodes each packet into binary and prints it out to stderr, and can see the initial consistent packets at the start which I'd been identified before manually decoding in audacity. I'm sure you could do a much cleaner job. Still not sure how to decode this into mA though. Will be trying to break up into bytes and verifying the checksum next.
e2-decode.c
https://mega.co.nz/#!WwBHCRbA!W3E6oRhkqeNCMfQbpMp4cXAdVJAbP2nxPJ7MlrCkP4A
Dump out:
rtl_fm -f 433460000 -s 200000 -r 96000 -g 28 | ./e2-decode -r 96000
Found 1 device(s):
0: Realtek, RTL2838UHIDIR, SN: 00000001
Using device 0: ezcap USB 2.0 DVB-T/DAB/FM dongle
Found Rafael Micro R820T tuner
Oversampling input by: 6x.
Oversampling output by: 1x.
Buffer size: 6.83ms
Tuned to 433760000 Hz.
Sampling at 1200000 Hz.
Output at 96000 Hz.
Tuner gain set to 28.00 dB.
000000001000000110010011010000000000001000000000000000101010111000000110
000000001000000110010011010000000000001000000000000000101010111100000111
000000001000000110010011010000000000001000000000000000101010111100000111
000000001000000110010011010000000000001000000000000000101010111000000110
000000001000000110010011010000000000001000000000000000101010111000000110
000000001000000110010011010000000000001000000000000000101011000000001000
000000001000000110010011010000000000001000000000000000101011000100001001
000000001000000110010011010000000000001000000000000000101010111000000110
000000001000000110010011010000000000001000000000000000101010111100000111
000000001000000110010011010000000000001000000000000000101010111000000110
000000001000000110010011010000000000001000000000000000101011000000001000
000000001000000110010011010000000000001000000000000000101011000100001001
000000001000000110010011010000000000001000000000000000101011001000001010
000000001000000110010011010000000000001000000000000000101011000000001000
Peter said
at 3:03 pm on Aug 15, 2013
Oh yea and I guess another consideration for e2 decoding is which of the 3 plugs on the receiver the amp metre is plugged into. I see the bits shifting when I use different ports. A todo down the line to support varying ports....
Peter said
at 6:41 pm on Aug 15, 2013
Got it checksumming ok, and does so every time, but not getting anywhere with the decoding. Tallys ok for low values multiplying byte 7 below by 0.01 and then 230W, but higher currents don't have any luck. I can see byte 5 changing to 16/32 as I crank up the current usage.. The alex algo above doesn't work, nor does the lond method above, although I think its something along the lines of lond's method, but with only 1 channel.
860W @ 230V decimal numbers:
B0:0 B1:129 B2:147 B3:64 B4:1 B5:16 B6:2 B7:52 B8:155 CHECKSUM OK
updated e2-decode.c with checksumming and attempt at decode
https://mega.co.nz/#!rs4jDJiA!V7tMAzaql8VggpDLw7QndSdV6hdnSbp2FqkEmr3XdS4
joesito said
at 1:34 pm on Aug 16, 2013
Yes, same thing for me.... I can't figure out how to decode higher values....
Peter said
at 6:47 pm on Aug 15, 2013
Whereas low 462W does work as zero byte 5. Calc: [byte7] 199 * 0.01 * 230 = 457.7
B0:0 B1:129 B2:147 B3:64 B4:1 B5:0 B6:2 B7:199 B8:30 CHECKSUM OK i=1.99 P=457.70
spud said
at 8:10 pm on Aug 15, 2013
Great work here Peter and Joe...
alex said
at 4:53 pm on Aug 16, 2013
Mai I suggest the following approach:
- If you are on a tri-phase current, leave just one clamp, on one of the phases
- cut off all consumers in the house, except for the strict minimum
- plug in a as many variator lamps (the one where you can increase the brightness) or lightbulbs as possible. With 2-4 lamps you should get a pretty decent wattage (ex: 300 house consumption + 400w (4 lamps) you get a pretty nice amount)
- vary the current and measure the values. You will see the minimum increase at a given moment (8w for example)
- note down the values
- decode the values for one phase only
- do the same thing, with the same values but for the second phase alone (again, just one clamp but in the middle for ex).
- the same for the third
- the same with them all
It's just a suggestion, hope it helps. My E2 has 2 years almost since it is running flawless.
May I point also that Efergy has a new product, the Engage Hub, with an interface to their website. Bought it to compare results: their calculation on the "engage hub" is off by a fair degree (>12%)....
Peter said
at 5:13 pm on Sep 3, 2013
Prefer to try and get this decoded myself and not buy an engage hub - sounds like its not accurate anyways?
I'm still not getting anywhere with my e2 decoding (e.g. byte 6=1 byte 7=20, reading 712W @ 230V) single phase.
So I'm taking a different approach and attempting to create a lookup table, I've got a webcam pointed at my e2 receiver set up to take a picture of the reading on every received packet from my RTL-SDR decoder, naming the jpg file with the received values of byte 6 & 7 (e.g. I have a 001-020.jpg file which shows a reading of 712W). Over time I should end up with a directory full of images which I can either OCR or manually read and generate a lookup table.
alex said
at 7:12 am on Sep 7, 2013
I've migrated my code to a FEZ (.Net Micro Framework).
It makes me laugh, i've coded the PIC software in 2 days or so but managed to migrate it in 2h.
Drop a line if you're interrested. It uses the above detailed algorithm that does not seem to work on the newer efergy products.
alex said
at 7:27 am on Sep 7, 2013
One important part: if you're starting wrong (leading zeros etc), everything is shifted. Then it's very difficult to see a pattern. Wait for the 500us Pause, it's the best indicator for the message start. Everything afterwards is relevant message
00000011 01011101 10111001 01000000 01001010 01100101 00000100 00001100 10000000 00000000 (in my case)
take only the first 8 bytes like so
00000011 01011101 10111001 01000000 01001010 01100101 00000100 00001100
throw away bytes 0-3 (sync, etc) and 8 (checksum, can be used but no real formula found...) =>
01001010 01100101 00000100
then it's all simple:
Reading1 = 01001010
Reading2 = 01100101
Exponent = 00000100
double bigbyte = Reading1 * 256 + Reading2;
if (bigbyte == 0)
return 0;
if (Exponent != 255)
retvalue = voltage * (bigbyte / 32768f) * (System.Math.Pow(2, Exponent));
else
retvalue = voltage * (bigbyte / 32768f) * (System.Math.Pow(2, -1));
return retvalue;
Peter said
at 9:15 pm on Nov 14, 2013
Good to see the e2 classic v2.0 has been decoded over here http://rtlsdr-dongle.blogspot.com.au/2013/11/finally-complete-working-prototype-of.html
Tried it with my old e2 and it didn't work.
Still stumped with decoding the e2 but I have got lots of data points - resorted to setting up a system to webcam snap every time a unique packet was received, and pulled the data together in a spreadsheet. If any maths geniuses recognise what the function is between bytes 6 + 7 and the reading I'll be glad to hear it!! :)
Spreadsheet of data here (bytes 6 + 7 received / decoded from an e2 transmitter, with reading column being the reading seen on the e2 receiver for those values)
https://mega.co.nz/#!JAtTmTBA!SOo4AAUVkyFCqVI6NRSbKUQIst4VSD-DFsOYERmZnas
You don't have permission to comment on this page.